


Precision agriculture: Making sense of remotely sensed imagery
 Print
Print Email
EmailRemote sensing is a precision agriculture tool that provides a bird’s-eye view of crop conditions across our fields. Interpreting imagery is not always straightforward because crop growth is influenced by weather, soils and management practices.

Remote sensing is a precision agriculture tool that provides a bird’s-eye view of crop conditions across our fields. Interpreting imagery is not always straightforward because crop growth is influenced by weather, soils and management practices. However, remotely sensed imagery can reveal spatial patterns in crop health and productivity, helping identify where and how field conditions are changing.
Remote sensing 101
Current remote sensing technologies use specialized sensors to measure sunlight reflected by plants. These sensors capture visible light, called red, green and blue (RGB) wavelengths that we can see with our eyes, as well as wavelengths that we can’t see called near-infrared (NIR) (Table 1). These different wavelengths provide valuable information about plant health because plants absorb and reflect light differently depending on their overall condition. Chlorophyll, a pigment in the leaves, strongly absorbs visible light, particularly in the blue and red wavelengths, while a healthy leaf structure strongly reflects NIR. By comparing the reflectance across different portions of the spectrum, vegetation indices (VIs) can be calculated to highlight differences in crop growth, vigor and stress across the field.
Table 1. Sensor specifications, wavelengths, naming, and primary purpose in remote sensing technologies
|
Camera Sensor / Wavelength |
Type of Imagery |
Use Case |
|
RGB |
Visible |
Bird’s-eye view |
|
Blue ~ 450nm |
Multispectral blue |
Chlorophyll absorption |
|
Green ~ 560nm |
Multispectral green |
Leaf vigor, canopy color, senescence detection |
|
Red ~ 650nm |
Multispectral red |
Photosynthetic activity, vegetation cover |
|
Red-Edge ~730nm |
Multispectral red edge |
Chlorophyll absorption, nitrogen status |
|
Near-Infrared ~840nm |
Multispectral NIR |
Vegetation cover, canopy density, plant health and vigor |
Why do plants appear green?
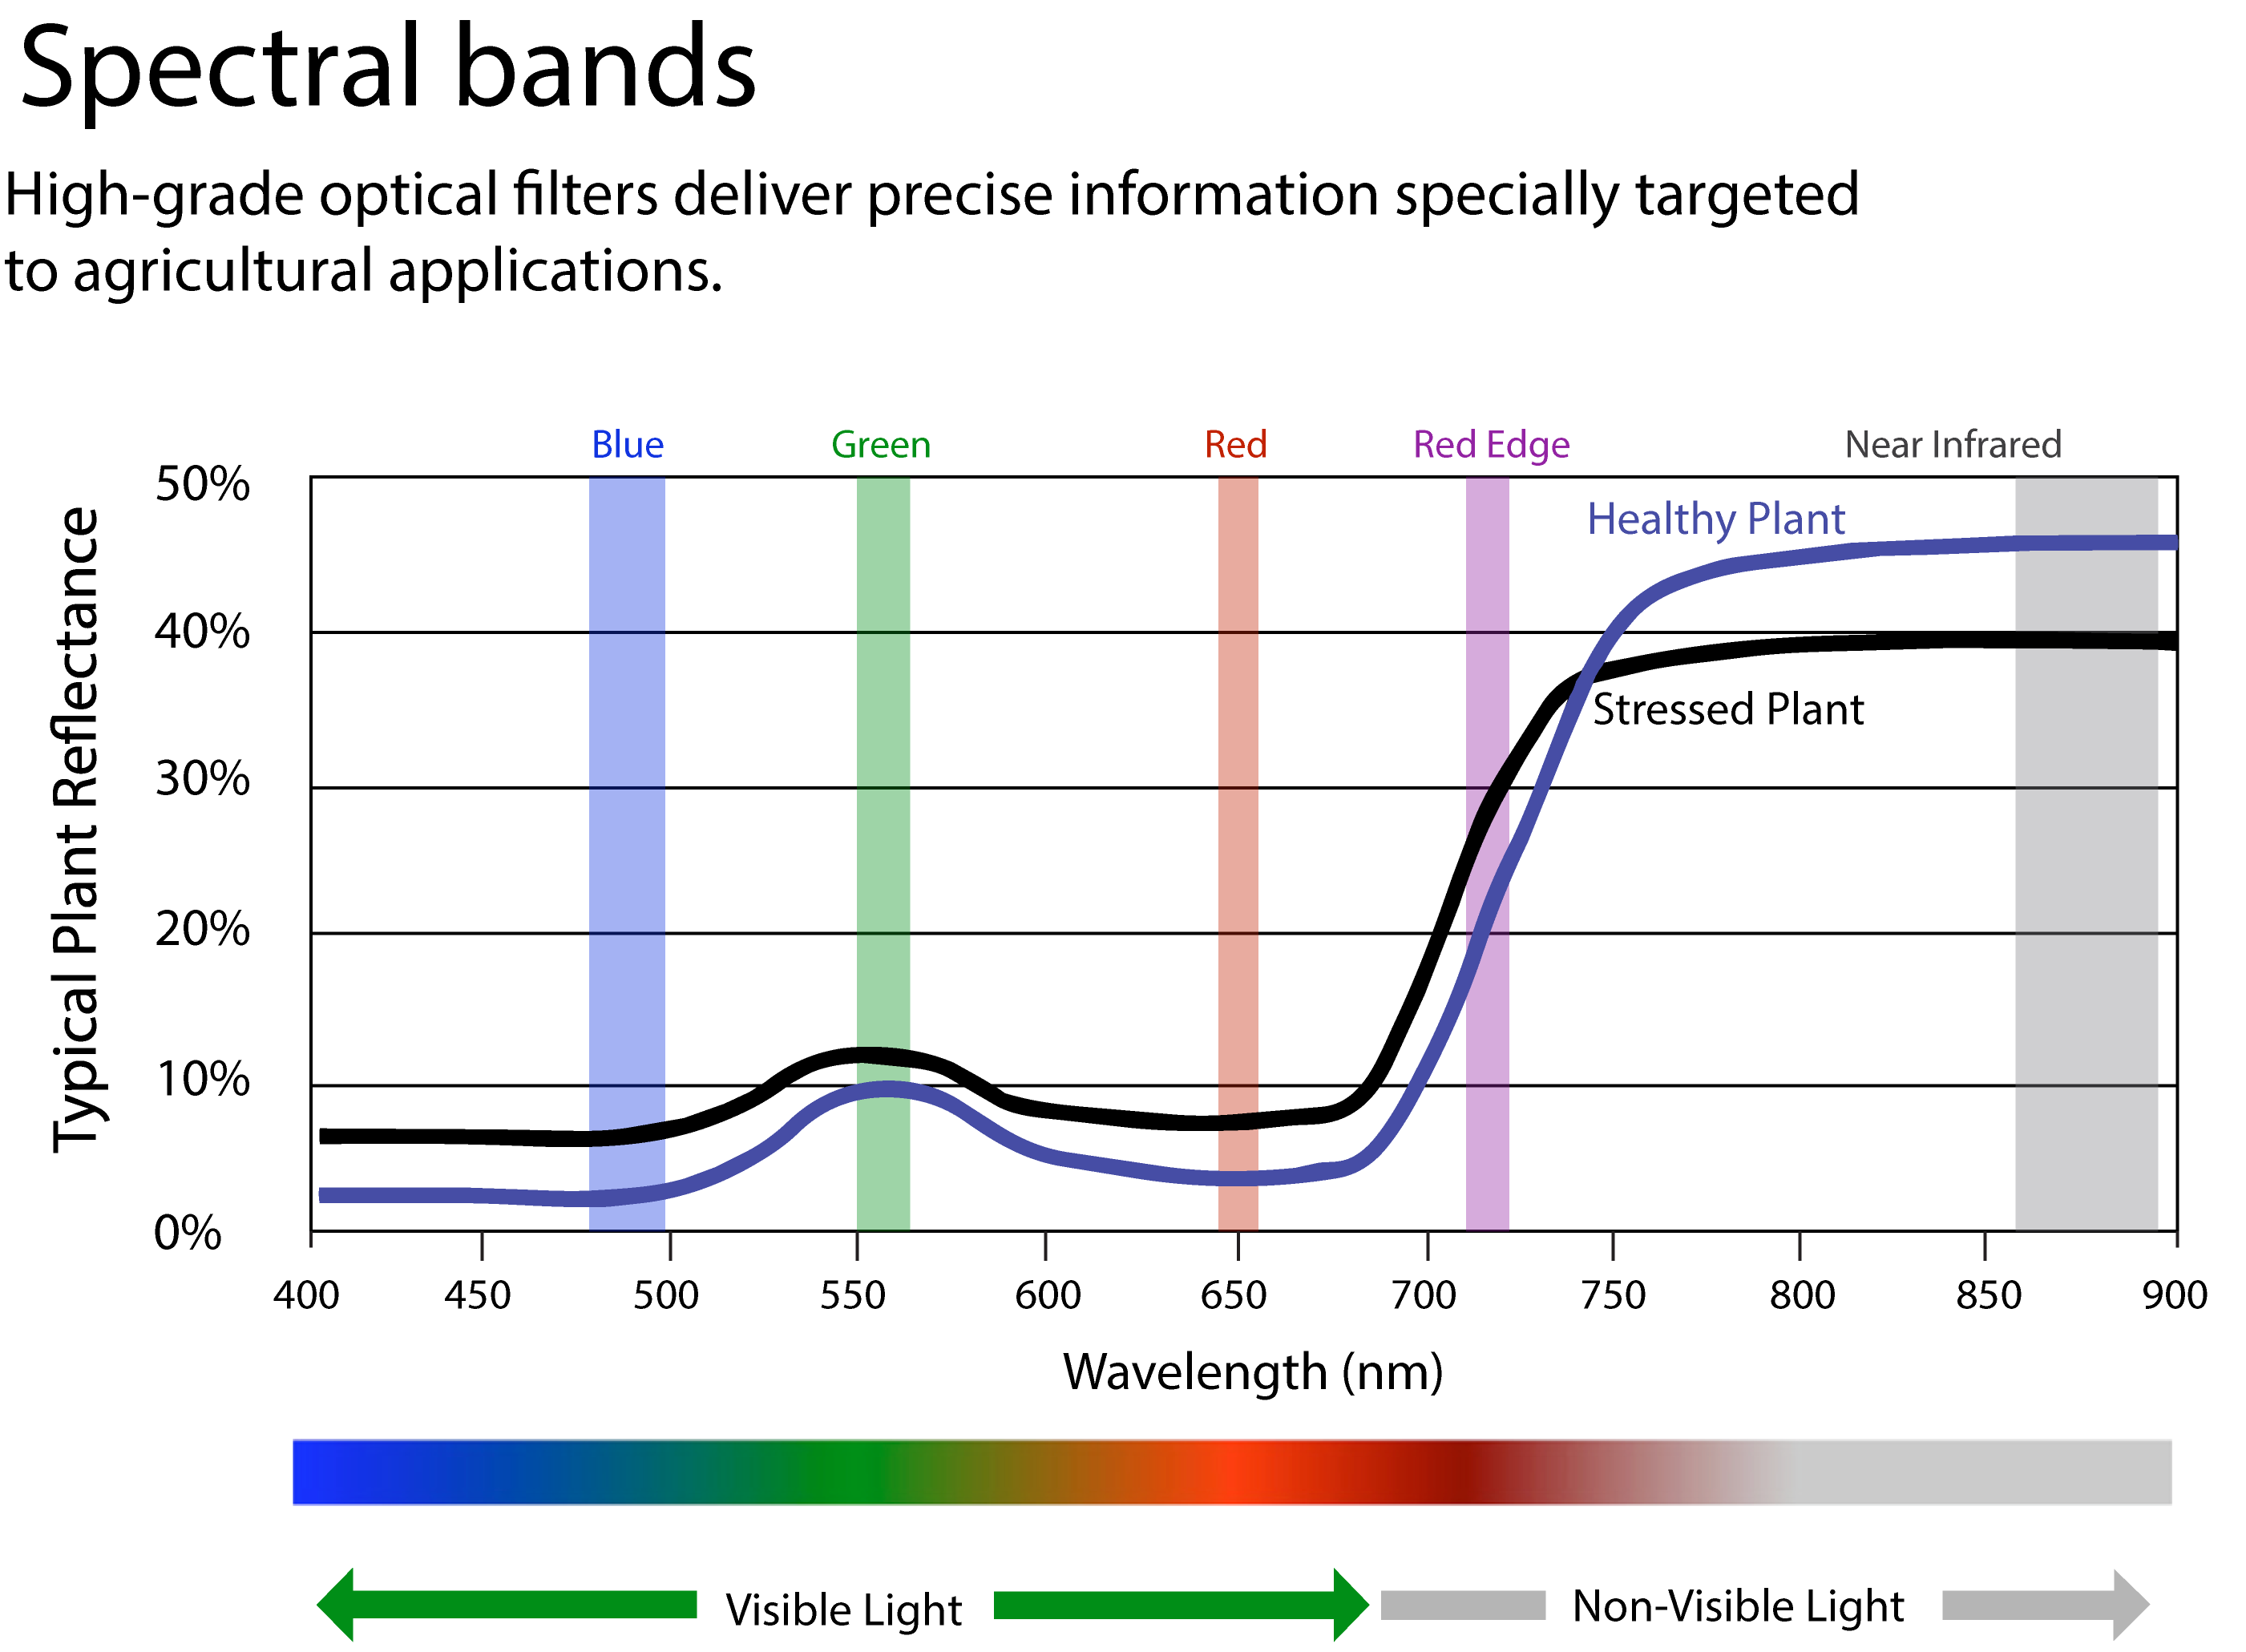
Of the primary colors that make up visible imagery, plants prefer blue and red to make chlorophyll in the leaves, therefore, they reflect more green light, which makes them appear green. This relationship can be seen by the slight bump in the amount of light reflected by both healthy and stressed plant lines in Figure 1. It’s important to highlight the difference in this relationship as the blue (representing healthy plants) and black (representing stressed plants) lines move into the non-visible NIR spectrum. Healthy plants reflect more NIR light, which is why VIs that use NIR light, like Normalized Difference Vegetation Index (NDVI), are common in precision agriculture. Other common indices and their benefits are listed in Table 2.
Using remotely sensed imagery
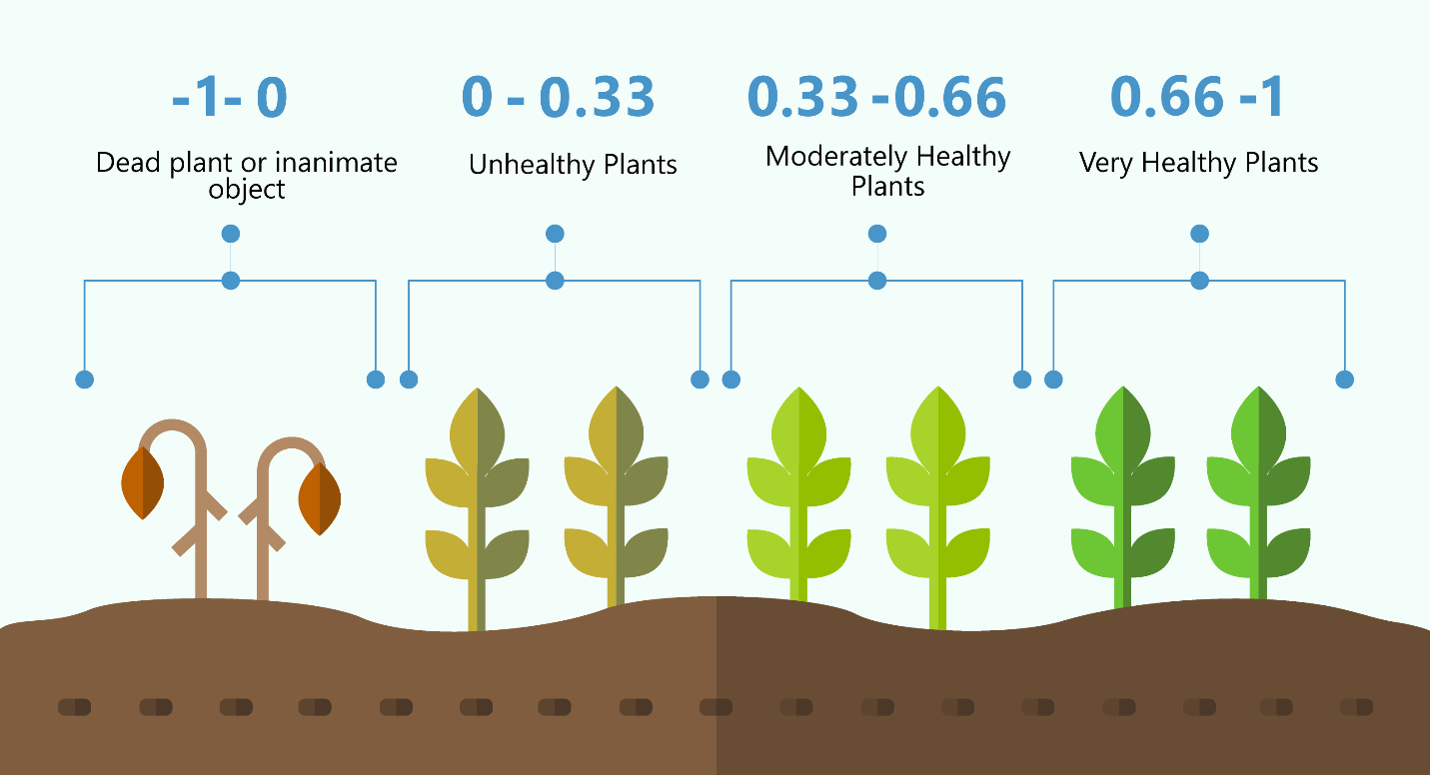
Figure 2 is an illustration of what NDVI values would look like on the ground with plants and their relative health. The values at 0 and below are dead material, or artificial structures like roads/buildings. Plants that are unhealthy display yellow, brown, orange and red hues in visible light and their NDVI would be between 0 and 0.33. Moderately healthy plants, which appear light green, have NDVI values between 0.33 and 0.66. Very healthy plants appear greener relative to other plants and have values between 0.66 and 1. Software platforms like Climate’s FieldView offer Field Health imagery of enrolled fields for free. This imagery uses satellites to generate vegetation maps based on their Climate Crop Index (CCI), a proprietary VI like NDVI that estimates relative biomass accumulation. It’s important to realize that light reflected by plants is a great indication of their overall health. And when looking at regions within the field rather than individual plants, we can easily identify how different areas change relative to another over time.
Table 2. Common vegetation indices used in precision agriculture
|
Vegetation Index |
Formula |
Primary Purpose |
|
Normalized Difference Vegetation Index (NDVI) |
(NIR - Red) |
Quantifying health and biomass accumulation |
|
Normalized Difference Red Edge (NDRE) (Barnes et al. 2000) |
(NIR - Red Edge) (NIR + Red Edge) |
Measures relative chlorophyll and is an indication of nitrogen status |
|
Green Normalized Difference Vegetation Index (GNDVI) (Gitelson et al. 1996) |
(NIR - Green) (NIR + Green) |
Better used in late-growth stages where crops are more developed to determine vegetative biomass accumulation |
|
Enhanced Vegetation Index (EVI) (Huete et al. 2002) |
2.5 x ( NIR - Red ) (NIR + 6x Red - 7.5 x Blue +1) |
Better for dense canopies and does not saturate |
Remote sensing is just one of the critical tools we use in precision agriculture. It works well in tandem with other datasets, like soil maps and historical yields. Historical yield data provides valuable ground-truth information for delineating management zones based on long-term crop productivity. Yield data collected by combine yield monitors reveal persistent spatial patterns in crop performance that can be used to characterize within-field variability and inform future management decisions. But what if we don’t have high-quality yield data? Can we use remote sensing instead?
More recent research has evaluated whether in-season satellite imagery can provide additional information about spatial variability beyond what is observed using historical yield data. Researchers compared patterns in satellite imagery collected throughout the growing season with yield patterns measured at harvest. One important finding was that multiple images collected throughout the growing season provided more useful information than a single image. This is particularly relevant because crop conditions can change throughout the season as plants respond to differences in weather and management. Remotely sensed imagery can help identify and monitor the changes in our fields. However, understanding what imagery can and can’t tell us is important:
- Imagery reveals spatial patterns and lets you know where the good (healthy) and bad (unhealthy) plants are in the field. Imagery can quantify these spatial differences and allows us to repeatedly observe the same areas of a field over multiple periods throughout the growing season. Plants act as sensors, reflecting their current growing conditions.
- Imagery can’t tell you why those plants are unhealthy, we need more data to discern the causes of unhealthy plants. Poor plant health can be a result of many factors, like nutrient limitations from soils, water stress, pests, diseases and others. Imagery must be combined with additional information to identify the underlying cause.
- Imagery doesn’t directly provide us with a recommendation or rates for additional fertilizer or nutrients. VIs can assess crop conditions, but they don’t independently determine rates necessary for fertilizer or soil amendment applications. These decisions require more data from either soil sampling or crop modeling from an expected yield response.
What this means
Remote sensing is a powerful tool for identifying and monitoring spatial differences within fields, particularly during the growing season. While imagery alone can’t diagnose causes of crop stress, combining it with other data can provide greater context and support more informed management decisions. MSU Extension can help farmers organize, analyze, and interpret precision agriculture data to turn these observations into actionable management decisions.

